
Are you parallelizing your raster operations? You should!
If you plan to do anything with the raster package you should definitely consider parallelize all your processes, especially if you are working with very large image files. I couldn’t find any blog post describing how to parallelize with the raster package (it is well documented in the package documentation, though). So here my notes.
Load some example data
Let’s first get some raster data from here, any file will do but I’m using the Cambodian population data for 2015 (KHM_ppp_v2b_2015_UNadj).
library(raster)
khm_pop.r <-
  raster("~/Downloads/KHM_ppp_v2b_2015_UNadj/KHM_ppp_v2b_2015_UNadj.tif")
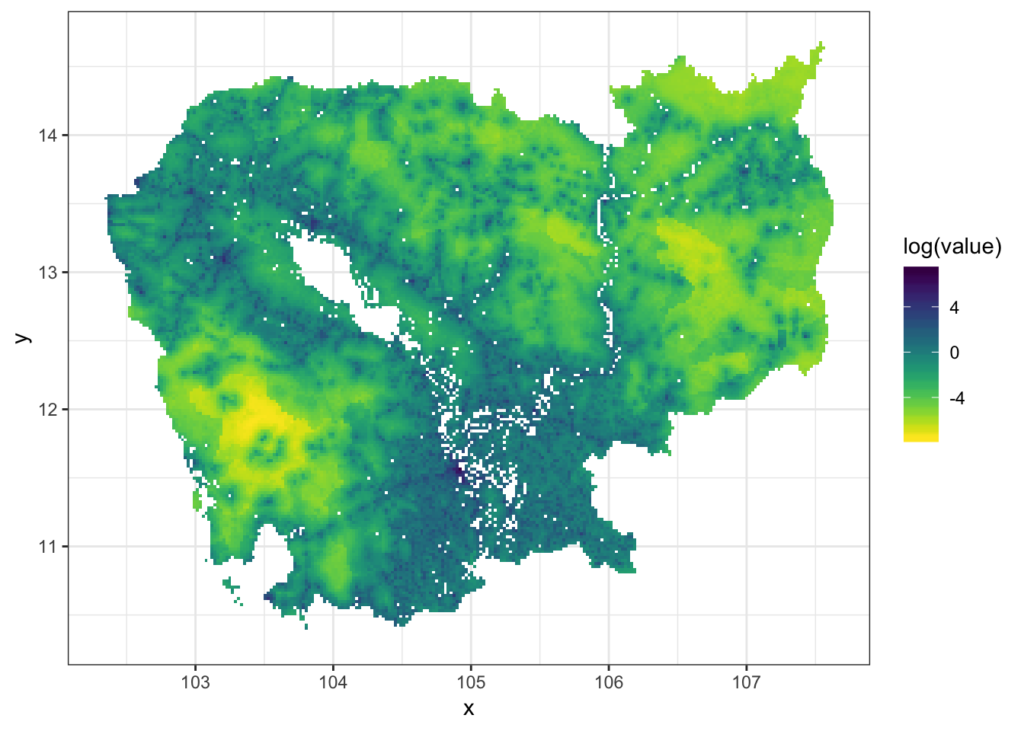
We can plot it with
library(rasterVis)
library(viridis)
library(ggplot2)
rasterVis::gplot(khm_pop.r) +
  geom_tile(aes(fill = log(value)))  +
  viridis::scale_fill_viridis(direction = -1,
                              na.value='#FFFFFF00') +
  theme_bw()
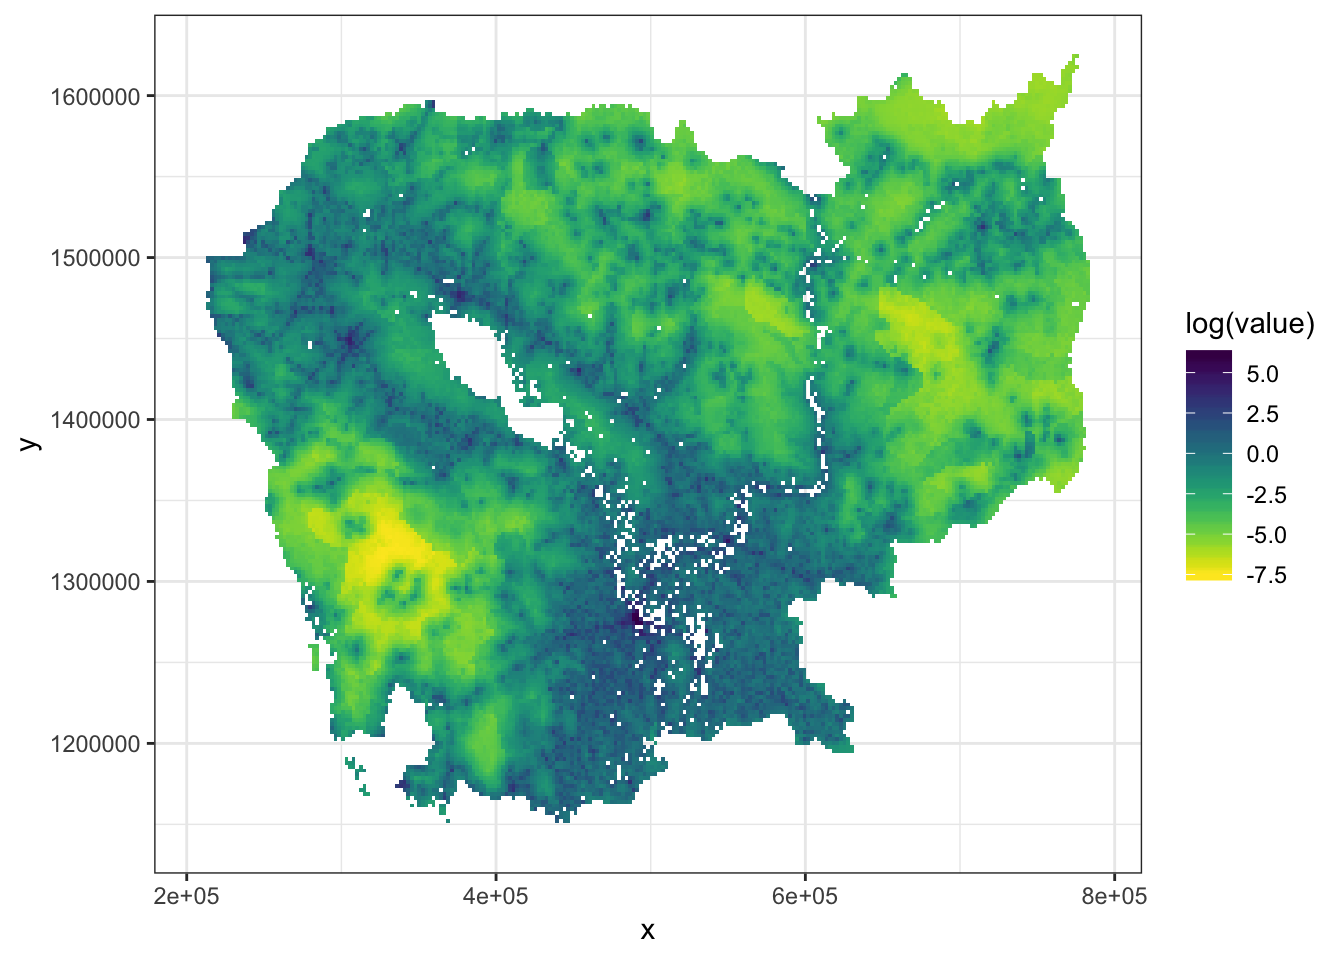
Projection
Now, let’s first project the raster without any parallelization.
start_time <- Sys.time()
res1 <-
  projectRaster(khm_pop.r,
                crs = '+proj=utm +zone=48 +datum=WGS84 +units=m +no_defs')
end_time <- Sys.time()
end_time - start_time
## Time difference of 1.088329 mins
rasterVis::gplot(res1) +
  geom_tile(aes(fill = log(value)))  +
  viridis::scale_fill_viridis(direction = -1,
                              na.value='#FFFFFF00') +
  theme_bw()
And now let’s parallelize the process. There are two approaches to parallelization with raster objects (do ?clusterR for the documentation of the package mantainers):
- By including the raster function between a
beginCluster()and anendCluster(). - By using
clusterR()like inclusterR(x, fun, args=NULL, cl=mycluster), wheremyclusteris a cluster object generated for example bygetCluster().
Yet clusterR() doesn’t work with merge, crop, mosaic, disaggregate, aggregate, resample, projectRaster, focal, distance, buffer and direction.
Let’s try the first approach first.
start_time <- Sys.time()
  beginCluster()
## 4 cores detected, using 3
  res2 <-
    projectRaster(khm_pop.r,
                  crs = '+proj=utm +zone=48 +datum=WGS84 +units=m +no_defs')
## Using cluster with 3 nodes
  endCluster()
end_time <- Sys.time()
end_time - start_time
## Time difference of 1.548856 mins
rasterVis::gplot(res2) +
  geom_tile(aes(fill = log(value)))  +
  viridis::scale_fill_viridis(direction = -1, na.value='#FFFFFF00') +
  theme_bw()

Maths
To test the second approach, let’s use the calc() and sqrt() functions, first without parallelization:
start_time <- Sys.time()
calc(khm_pop.r, sqrt)
## class       : RasterLayer
## dimensions  : 5205, 6354, 33072570  (nrow, ncol, ncell)
## resolution  : 0.0008333, 0.0008333  (x, y)
## extent      : 102.3375, 107.6323, 10.35008, 14.6874  (xmin, xmax, ymin, ymax)
## coord. ref. : +proj=longlat +datum=WGS84 +no_defs +ellps=WGS84 +towgs84=0,0,0
## data source : in memory
## names       : layer
## values      : 0.02269337, 42.87014  (min, max)
end_time <- Sys.time()
end_time - start_time
## Time difference of 3.316296 secs
and then with parallelization, this time with clusterR():
start_time <- Sys.time()
beginCluster()
## 4 cores detected, using 3
clusterR(khm_pop.r, sqrt)
## class       : RasterLayer
## dimensions  : 5205, 6354, 33072570  (nrow, ncol, ncell)
## resolution  : 0.0008333, 0.0008333  (x, y)
## extent      : 102.3375, 107.6323, 10.35008, 14.6874  (xmin, xmax, ymin, ymax)
## coord. ref. : +proj=longlat +datum=WGS84 +no_defs +ellps=WGS84 +towgs84=0,0,0
## data source : in memory
## names       : layer
## values      : 0.02269337, 42.87014  (min, max)
endCluster()
end_time <- Sys.time()
end_time - start_time
## Time difference of 16.49228 secs
When to parallelize and when don’t
In retrospect, reporting execution time doesn’t seem to make much sense since it points to a longer execution time under parallelization. But, please, consider that a net benefit from parallelization depends on three factors:
- How large is your image file;
- How many cores do you have access to (get how many with
parallel::detectCores()); - The overall clock speed of your processor.
In the test run on the Cambodian population raster, I used a relatively fast 4-core processor (3.1 GHz Intel Core i7). So there was actually no benefit (in fact it was counterproductive). But in another test I run on a much larger raster of size 24356 X 39798 (instead of the 5205 X 6354 size of the Cambodian example) parallelizing over 8 cores, the difference was very significant: a few minutes against more than one hour.