
Local participation and not unemployment explains the M5S result in the South
The abundance of economic data and the scarcity of social data with a comparable level of granularity is a problem for the quantitative analysis of social phenomena. I argue that this fundamental problem has misguided the analysis of the electoral results of the Five Star Movement (M5S) and its interpretation. In this article, I provide statistical evidence suggesting that — in the South — unemployment is not associated with the exceptional increase in the M5S support and that local participation is a stronger predictor of support than most of the demographics.
What happened
The 2018 Italian general elections (elections, since both the Chamber of Deputies and the Senate, were renewed) saw
- a significant increase in the number of votes for two parties, the Five Start Movement (M5S) and the League (formerly Northern League),
and
- an increase in the importance geography as an explanatory dimension for the distribution of votes.
The following two maps show where the M5S and the League have increased electoral support from 2013 to 2018. (Electoral data are always data for the election of the Chamber of Deputies).
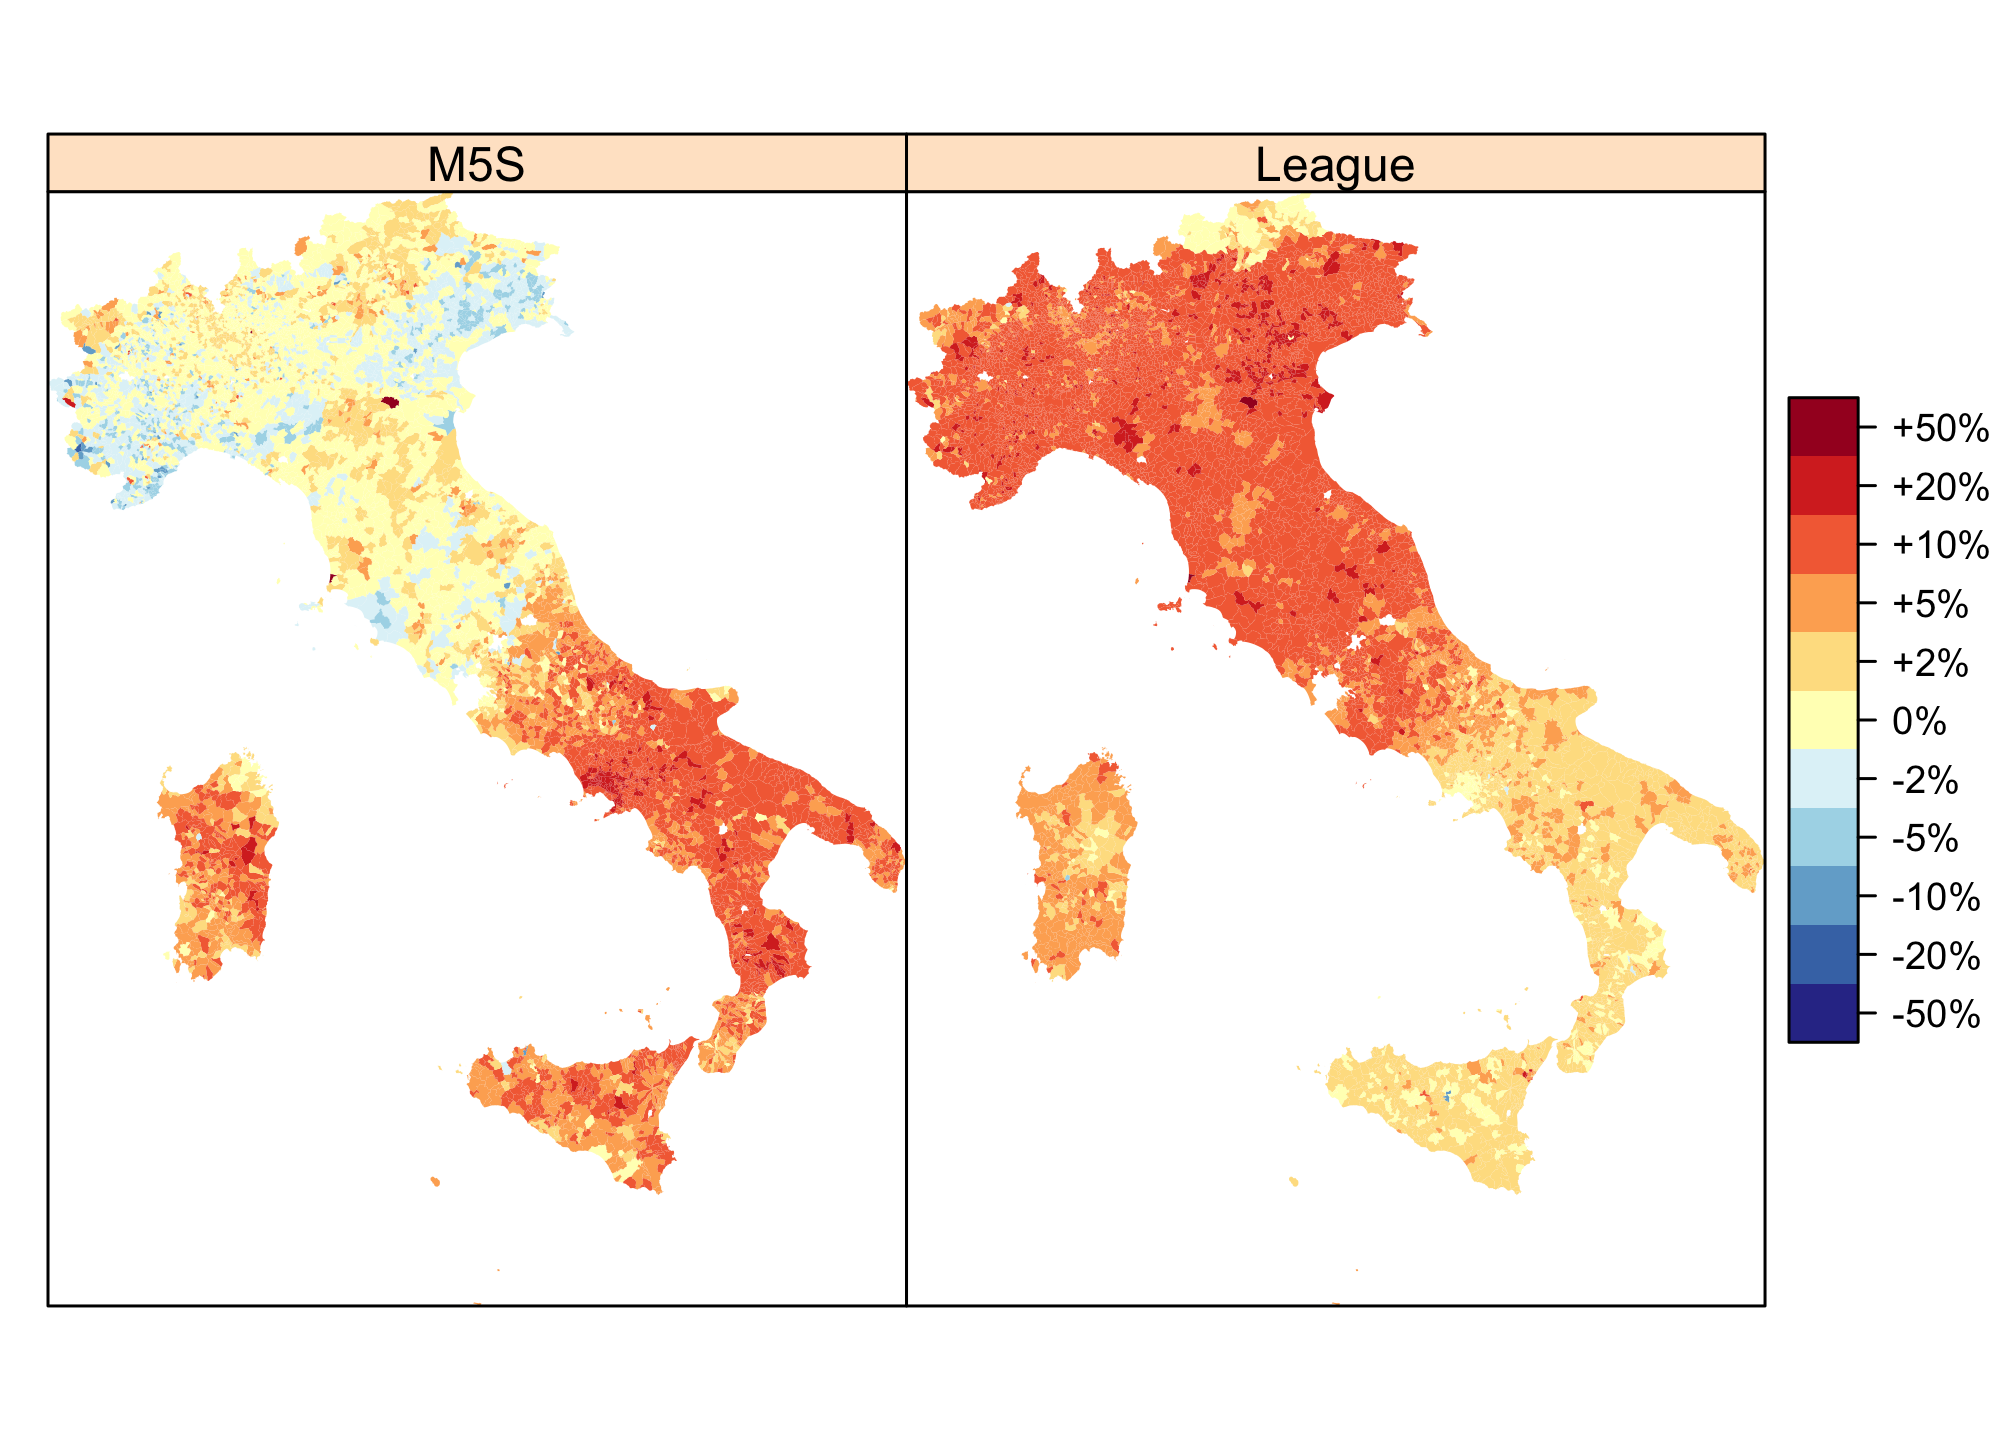
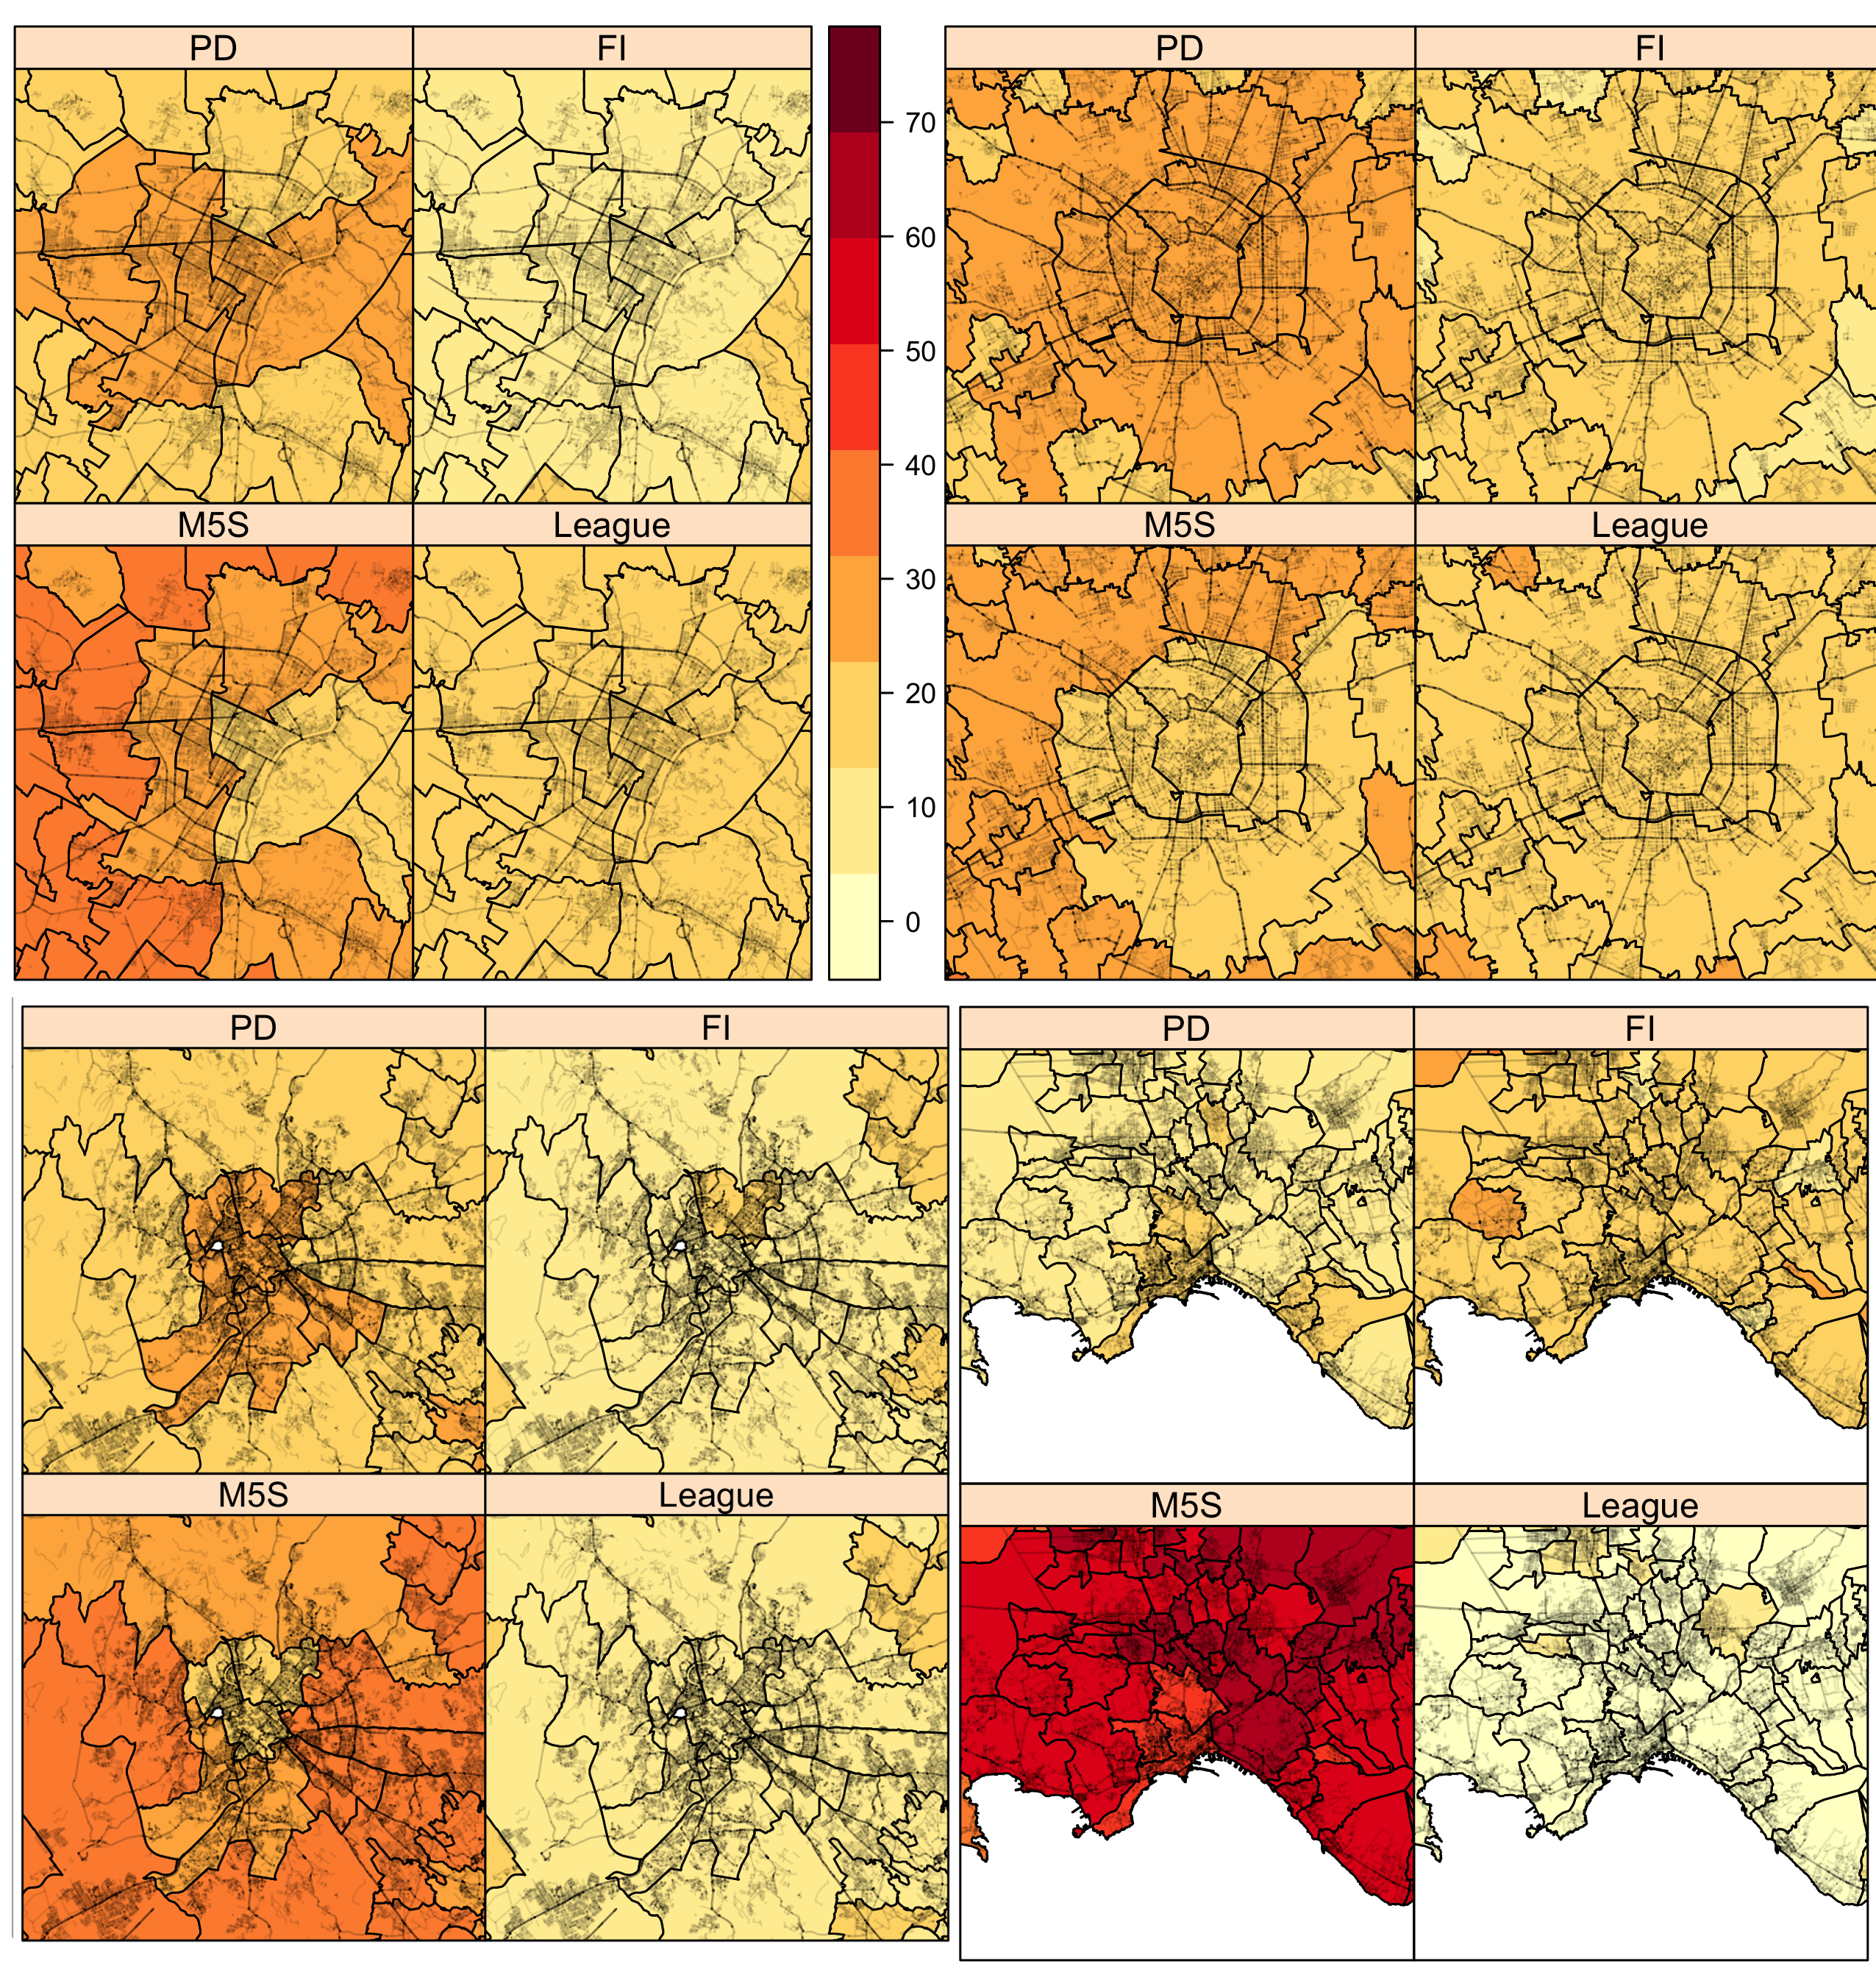
The geographic pattern is quite simple. The M5S has increased its support in the South and maintained its votes in the North, the League has significantly strengthened its support in the North but has also collected votes in the South, where it had virtually no support. The third and the fourth most voted parties, the Democratic Party (PD) and Berlusconi’s Forza Italia (FI), have lost votes almost everywhere. If we map the results of the four parties side-by-side with the same scale, the PD and FI almost faded into the background.

Yet, major metropolitan areas do not always follow the national trend. If Naples unambiguously voted M5S, Turin, Milan and Rome did saw the Democratic Party as the most voted party in the wealthiest districts.
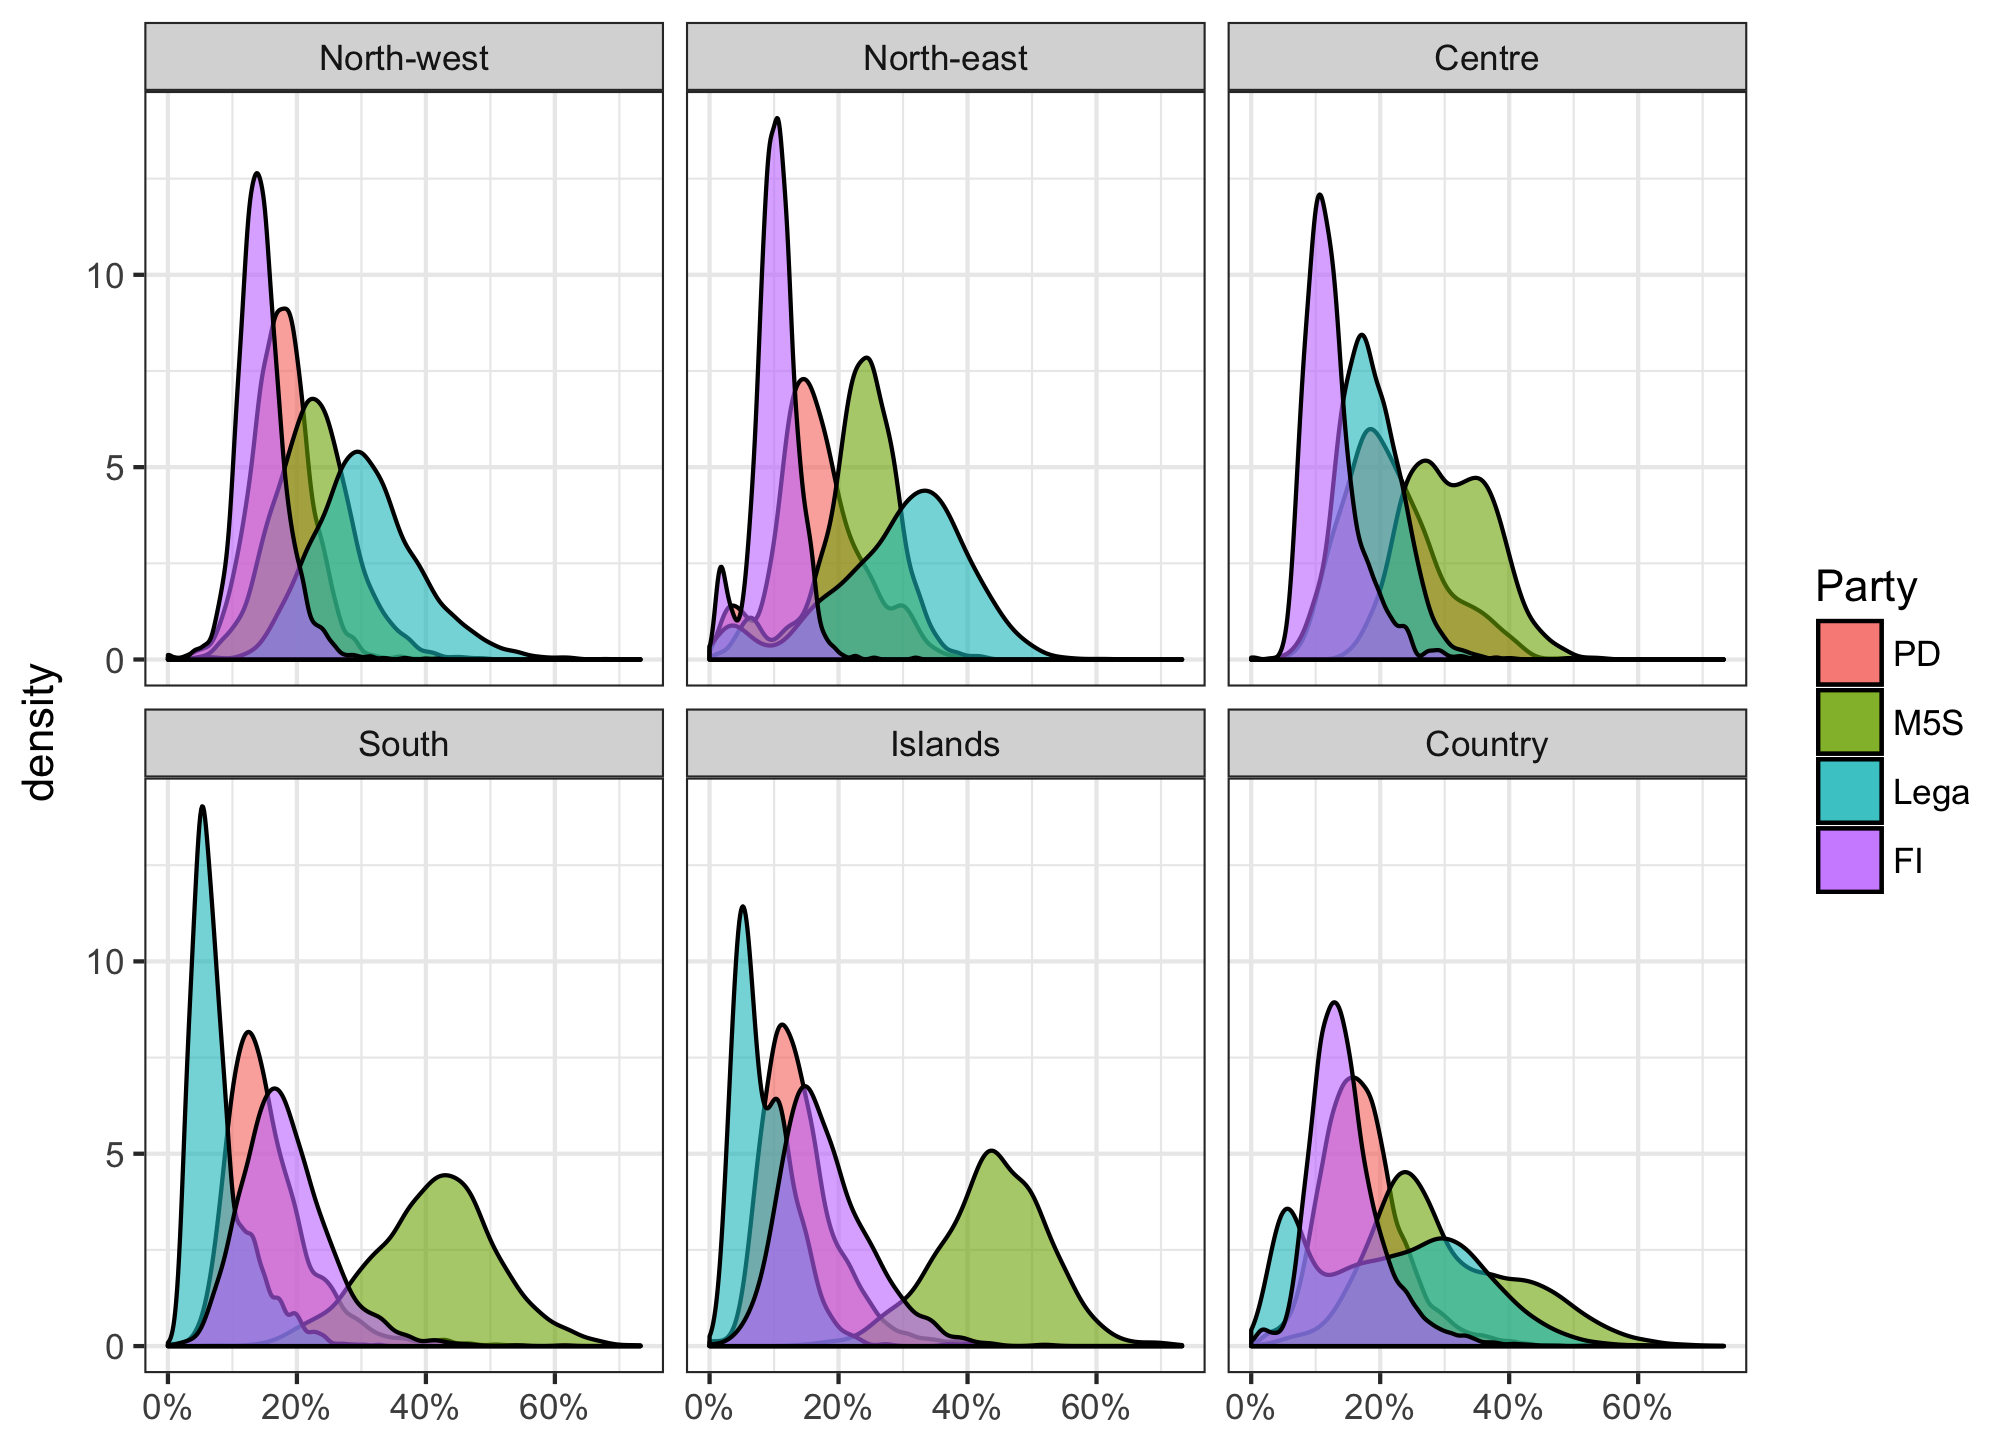
The density of the distribution of results at the commune and sub-commune level in the macro regions indicates that if the M5S electorally dominates in the South and in the two major islands, the League is the most popular party in the North.
The territoriality of the results, especially along the North-South dimension, makes the analysis especially complicated. This because the strong result of the League in the North and of the M5S in the South might simplistically suggest that immigration (which is much stronger in the North) explains the League’s result in the North and unemployment and poverty (stronger in the South) explain the M5S’s result in the South. This reading is especially attractive since immigration and the M5S proposal to introduce a guaranteed minim income have dominated the campaign.
Correlates of the M5S votes
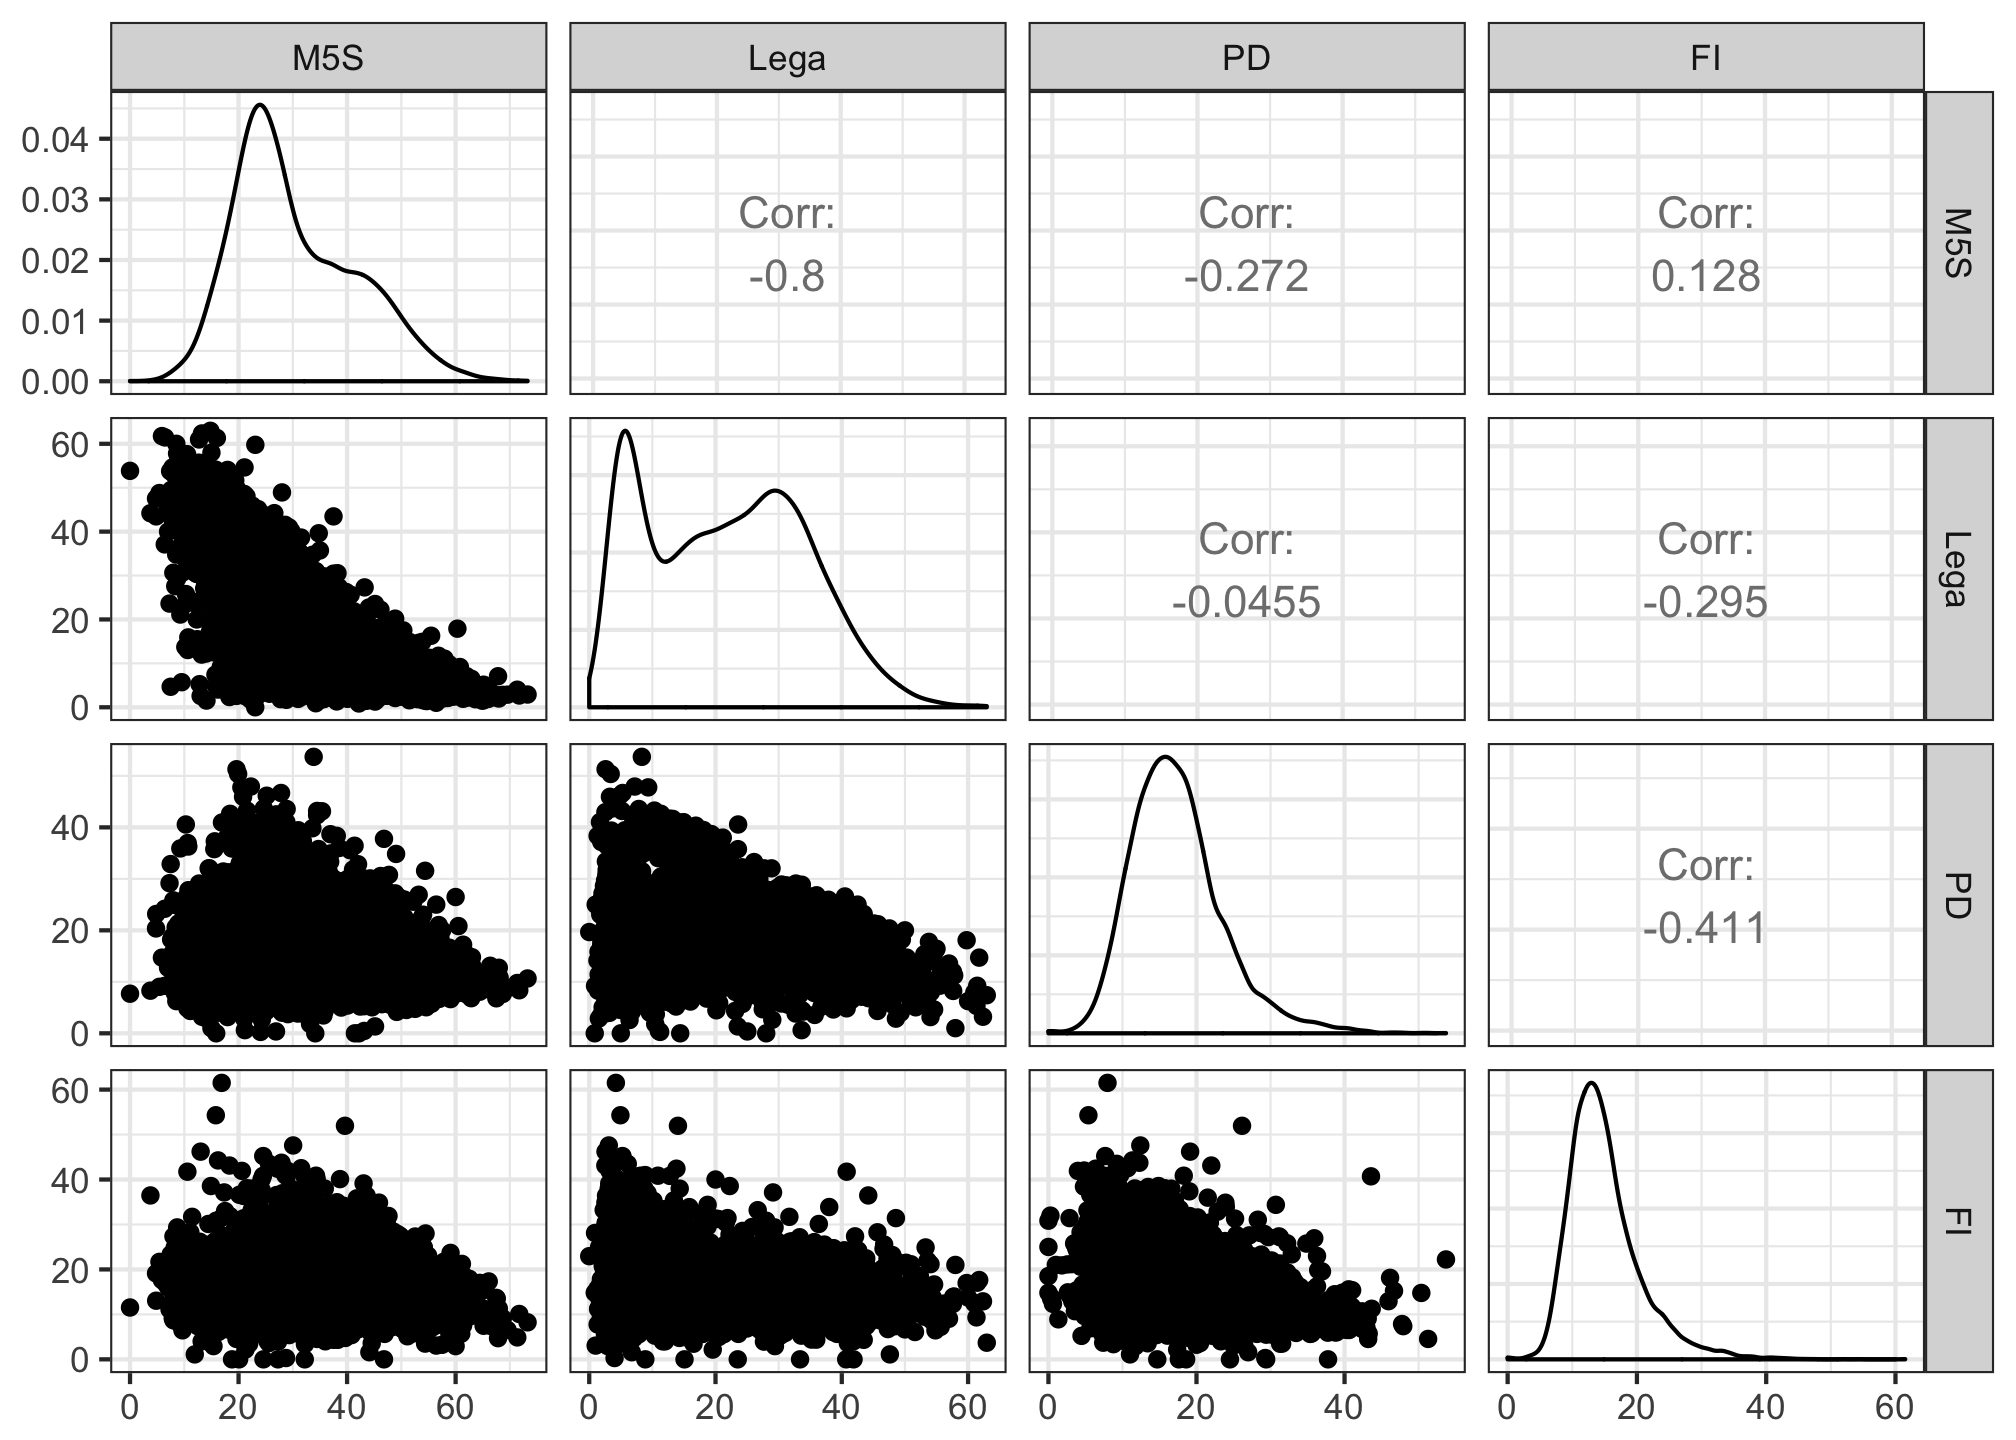
What the electoral geography clearly describes is an antithetic and territorially driven relationship between the M5S and the League. The M5S vote is strongly and negatively correlated with the League vote.
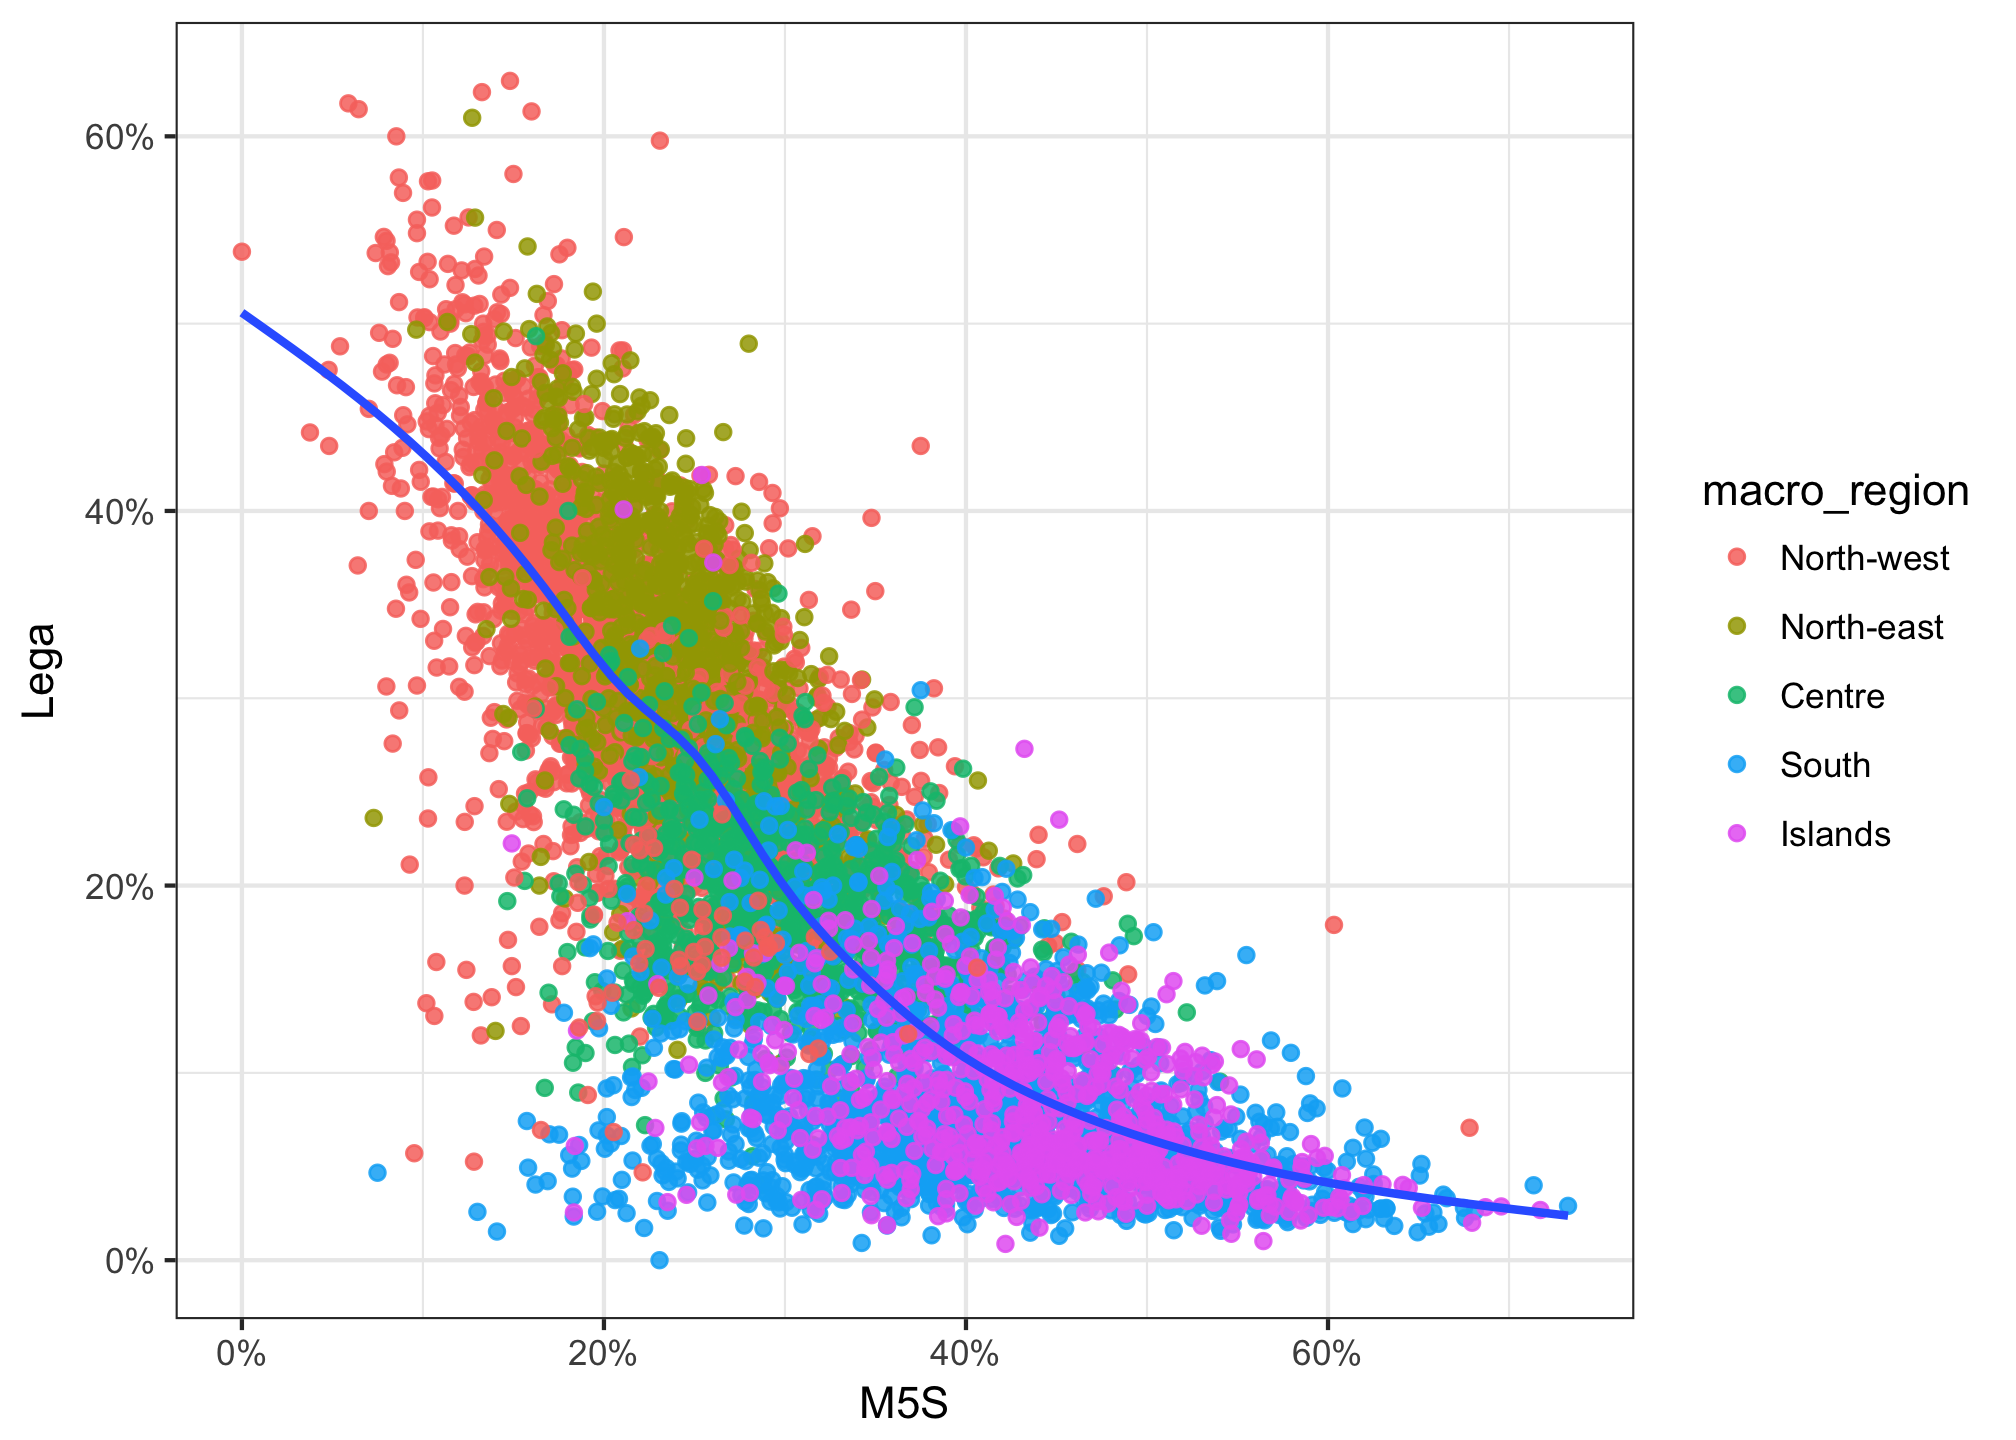
When we exclude the provinces of Trento and Bolzano (because of their autonomous status have a different party tradition), the correlation between the League and the M5S vote is 80%. No other two parties share the same correlation:
In a first model, I use data from the lower geographic level possible — either the commune level or the sub-commune level for large metropolitan areas. I then test the association of the results of each of the 7981 geographies with the census demographics from 2011.
| Dependent variable: | |||||
| M5S % | |||||
| Country | Centre-north | South and islands | South | Islands | |
| (1) | (2) | (3) | (4) | (5) | |
| Pop. density (log) | 0.005*** | 0.005*** | 0.010*** | 0.010*** | 0.011*** |
| (0.001) | (0.001) | (0.002) | (0.002) | (0.003) | |
| Unemployment % | 1.301*** | 1.310*** | 0.042 | 0.177** | -0.170** |
| (0.031) | (0.040) | (0.052) | (0.073) | (0.085) | |
| Housewives % | -0.013 | -0.128*** | 0.308*** | 0.336*** | 0.154*** |
| (0.020) | (0.022) | (0.031) | (0.041) | (0.056) | |
| Not workforce below 65 % | 0.801*** | 0.340*** | -0.058 | -0.063 | 0.024 |
| (0.018) | (0.025) | (0.039) | (0.044) | (0.095) | |
| Over 65% | -1.555*** | -0.526*** | -0.046 | 0.003 | -0.380* |
| (0.048) | (0.060) | (0.092) | (0.108) | (0.205) | |
| With degree % | 0.382*** | 0.267*** | -0.146** | -0.178** | -0.043 |
| (0.037) | (0.035) | (0.068) | (0.080) | (0.134) | |
| Foreign pop. % | -0.305*** | 0.057** | -0.602*** | -0.561*** | -0.385 |
| (0.032) | (0.028) | (0.091) | (0.102) | (0.262) | |
| Foreign African pop. % | -0.409*** | -0.371*** | 0.485** | 0.464 | 0.001 |
| (0.077) | (0.065) | (0.238) | (0.284) | (0.540) | |
| Constant | 0.145*** | 0.155*** | 0.513*** | 0.482*** | 0.599*** |
| (0.012) | (0.011) | (0.025) | (0.030) | (0.053) | |
| Observations | 7,981 | 5,426 | 2,555 | 1,787 | 768 |
| R2 | 0.514 | 0.232 | 0.213 | 0.219 | 0.183 |
| Adjusted R2 | 0.514 | 0.231 | 0.211 | 0.216 | 0.174 |
| Note: | p<0.1; p<0.05; p<0.01 | ||||
Results indicate that if unemployment is strongly associated at the national level, it is not significant when we only considered the South (Sicily and Sardinia included). When we exclude the two main islands, unemployment is again significant but the association between M5S support and unemployment is weaker than between M5S and every other demographics with the exception of the percentage of the population with a university degree. And if we only consider the two main islands unemployment is actually negatively correlated with the M5S.
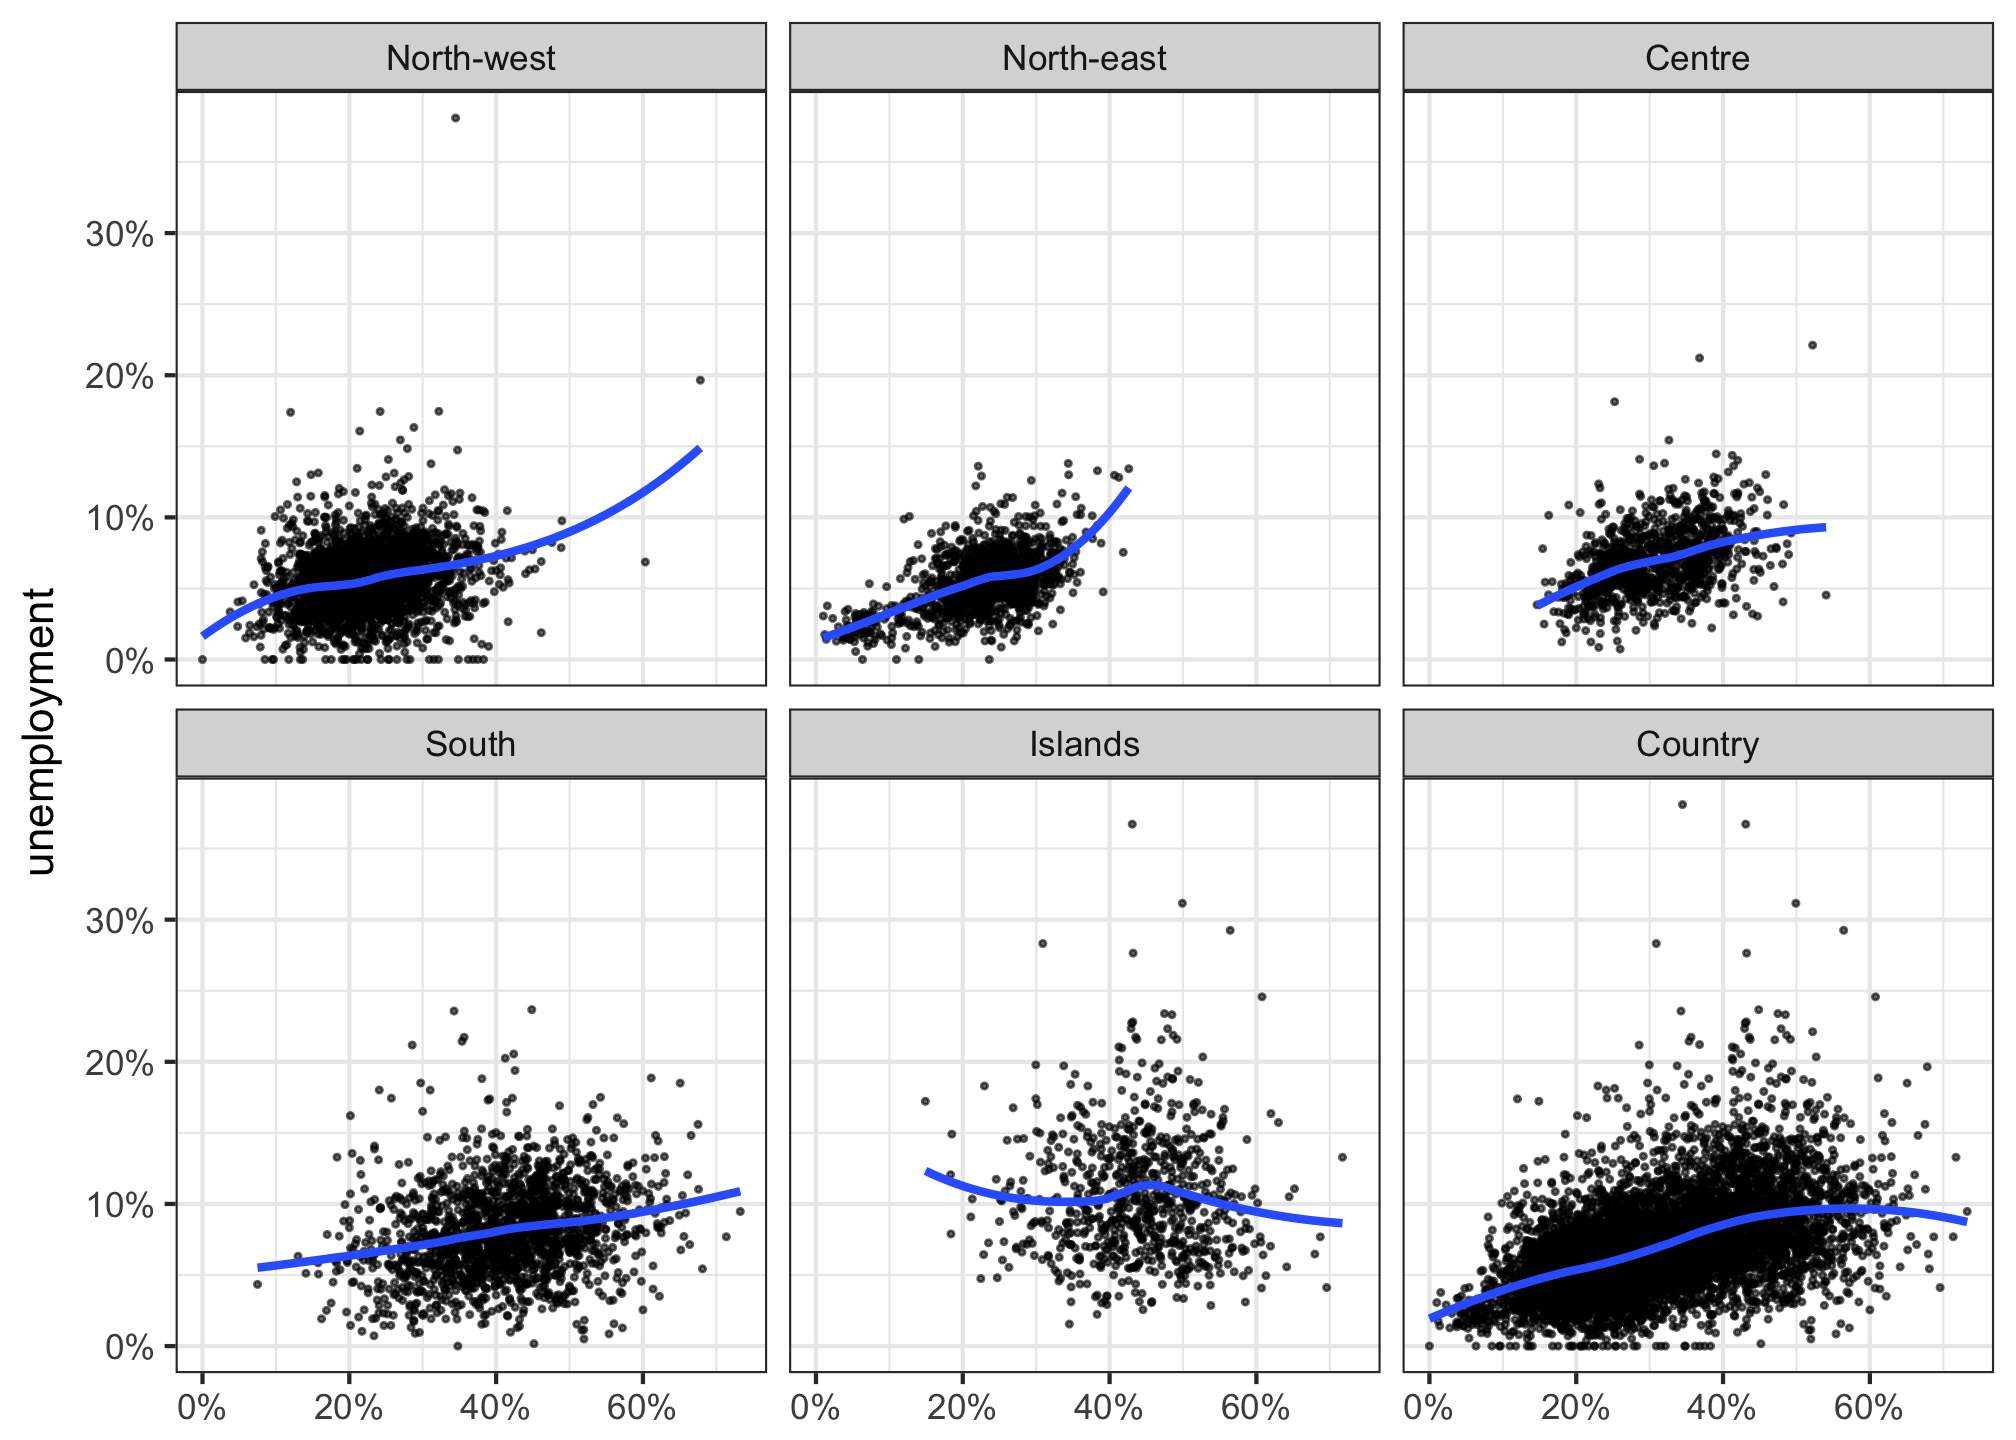
The unemployment rate is significantly higher in the South; almost all the geographies with an unemployment rate above 40% are indeed in the South. It is possible to assume a non-linear relation between M5S support and unemployment: for example, strong below 40% and null above. Still, this is not fully supported by a locally weighted regression line (LOESS) fitted to the data generated by the elections in the different macro-regions (see Figure above). And it does not explain the behaviour in Sicily and Sardinia (with a median support for the M5S of 44% against a national median of 27%) where unemployment is actually associated with less support for the M5S.
In a second model, I use the results of the 2018 elections at the commune level and the results of the 2013 elections. This allows introducing a variable capturing the relative change in support for the Movement.
| Dependent variable: | |||||
| M5S (% difference 2018-2013) | |||||
| Country | Centre-north | South and islands | South | Islands | |
| (1) | (2) | (3) | (4) | (5) | |
| Pop. density (log) | 0.311*** | -0.081 | 1.042*** | 0.758*** | 0.385** |
| (0.066) | (0.075) | (0.117) | (0.136) | (0.189) | |
| Unemployment % | 19.881*** | 14.514*** | -13.452*** | -2.866 | -10.826** |
| (2.401) | (3.577) | (3.298) | (4.477) | (4.739) | |
| Housewives % | -13.648*** | -6.628*** | -11.022*** | 11.527*** | -19.920*** |
| (1.423) | (1.890) | (1.996) | (2.534) | (3.118) | |
| Not workforce below 65 % | 35.105*** | 21.025*** | 6.329** | 2.604 | -3.537 |
| (1.672) | (2.179) | (2.677) | (2.929) | (5.463) | |
| Over 65% | -86.571*** | -48.932*** | -30.710*** | -16.508** | -1.456 |
| (3.953) | (5.202) | (6.376) | (7.233) | (11.674) | |
| With degree % | 41.954*** | 17.568*** | -5.123 | -18.126*** | -3.130 |
| (2.863) | (3.495) | (5.443) | (6.206) | (9.518) | |
| Foreign pop. % | -30.620*** | -6.190** | -34.248*** | -54.868*** | -24.128* |
| (2.232) | (2.417) | (5.792) | (6.213) | (14.640) | |
| Foreign African pop. % | 4.172 | 4.631 | -12.408 | 17.876 | 4.595 |
| (5.486) | (5.560) | (15.141) | (17.107) | (30.140) | |
| Income (’000 € per capita) | -0.937*** | -0.184*** | -0.547*** | -0.463*** | -0.498*** |
| (0.035) | (0.043) | (0.095) | (0.115) | (0.150) | |
| Constant | 17.462*** | 1.087 | 33.976*** | 26.448*** | 26.662*** |
| (1.084) | (1.349) | (1.682) | (1.963) | (3.096) | |
| Observations | 7,936 | 5,388 | 2,548 | 1,782 | 766 |
| R2 | 0.473 | 0.038 | 0.154 | 0.255 | 0.105 |
| Adjusted R2 | 0.472 | 0.036 | 0.151 | 0.252 | 0.094 |
| Note: | p<0.1; p<0.05; p<0.01 | ||||
When the South (this time both including and excluding the two main islands) is considered in isolation from the rest of the country, unemployment unambiguously is not a positive correlate of electoral support: as a matter of fact, it is significantly but negatively correlated. Only a lower per capita income seems to be an important determinant of the support for the Movement throughout the country.
In conclusion, unemployment is not a satisfactory explanation for the unprecedented result of the M5S in the South, whether we consider the median income of the population or not or whether we consider the results in the 2018 general election both in terms of absolute votes or in terms of the relative increase in the number of the previous general elections. A “standalone” economic answer as an explanation of the success M5S is far from convincing. I am not disputing that economic anxiety plays a role in the electorate of the M5S. But unemployment is not necessarily part of the mix. According to the Itanes 2013 electoral survey, M5S voters are more likely to be found in the workforce than non-M5S voters although crucially are more likely to experience economic hardship (see my Road to Rome: The organisational and political success of the M5S).
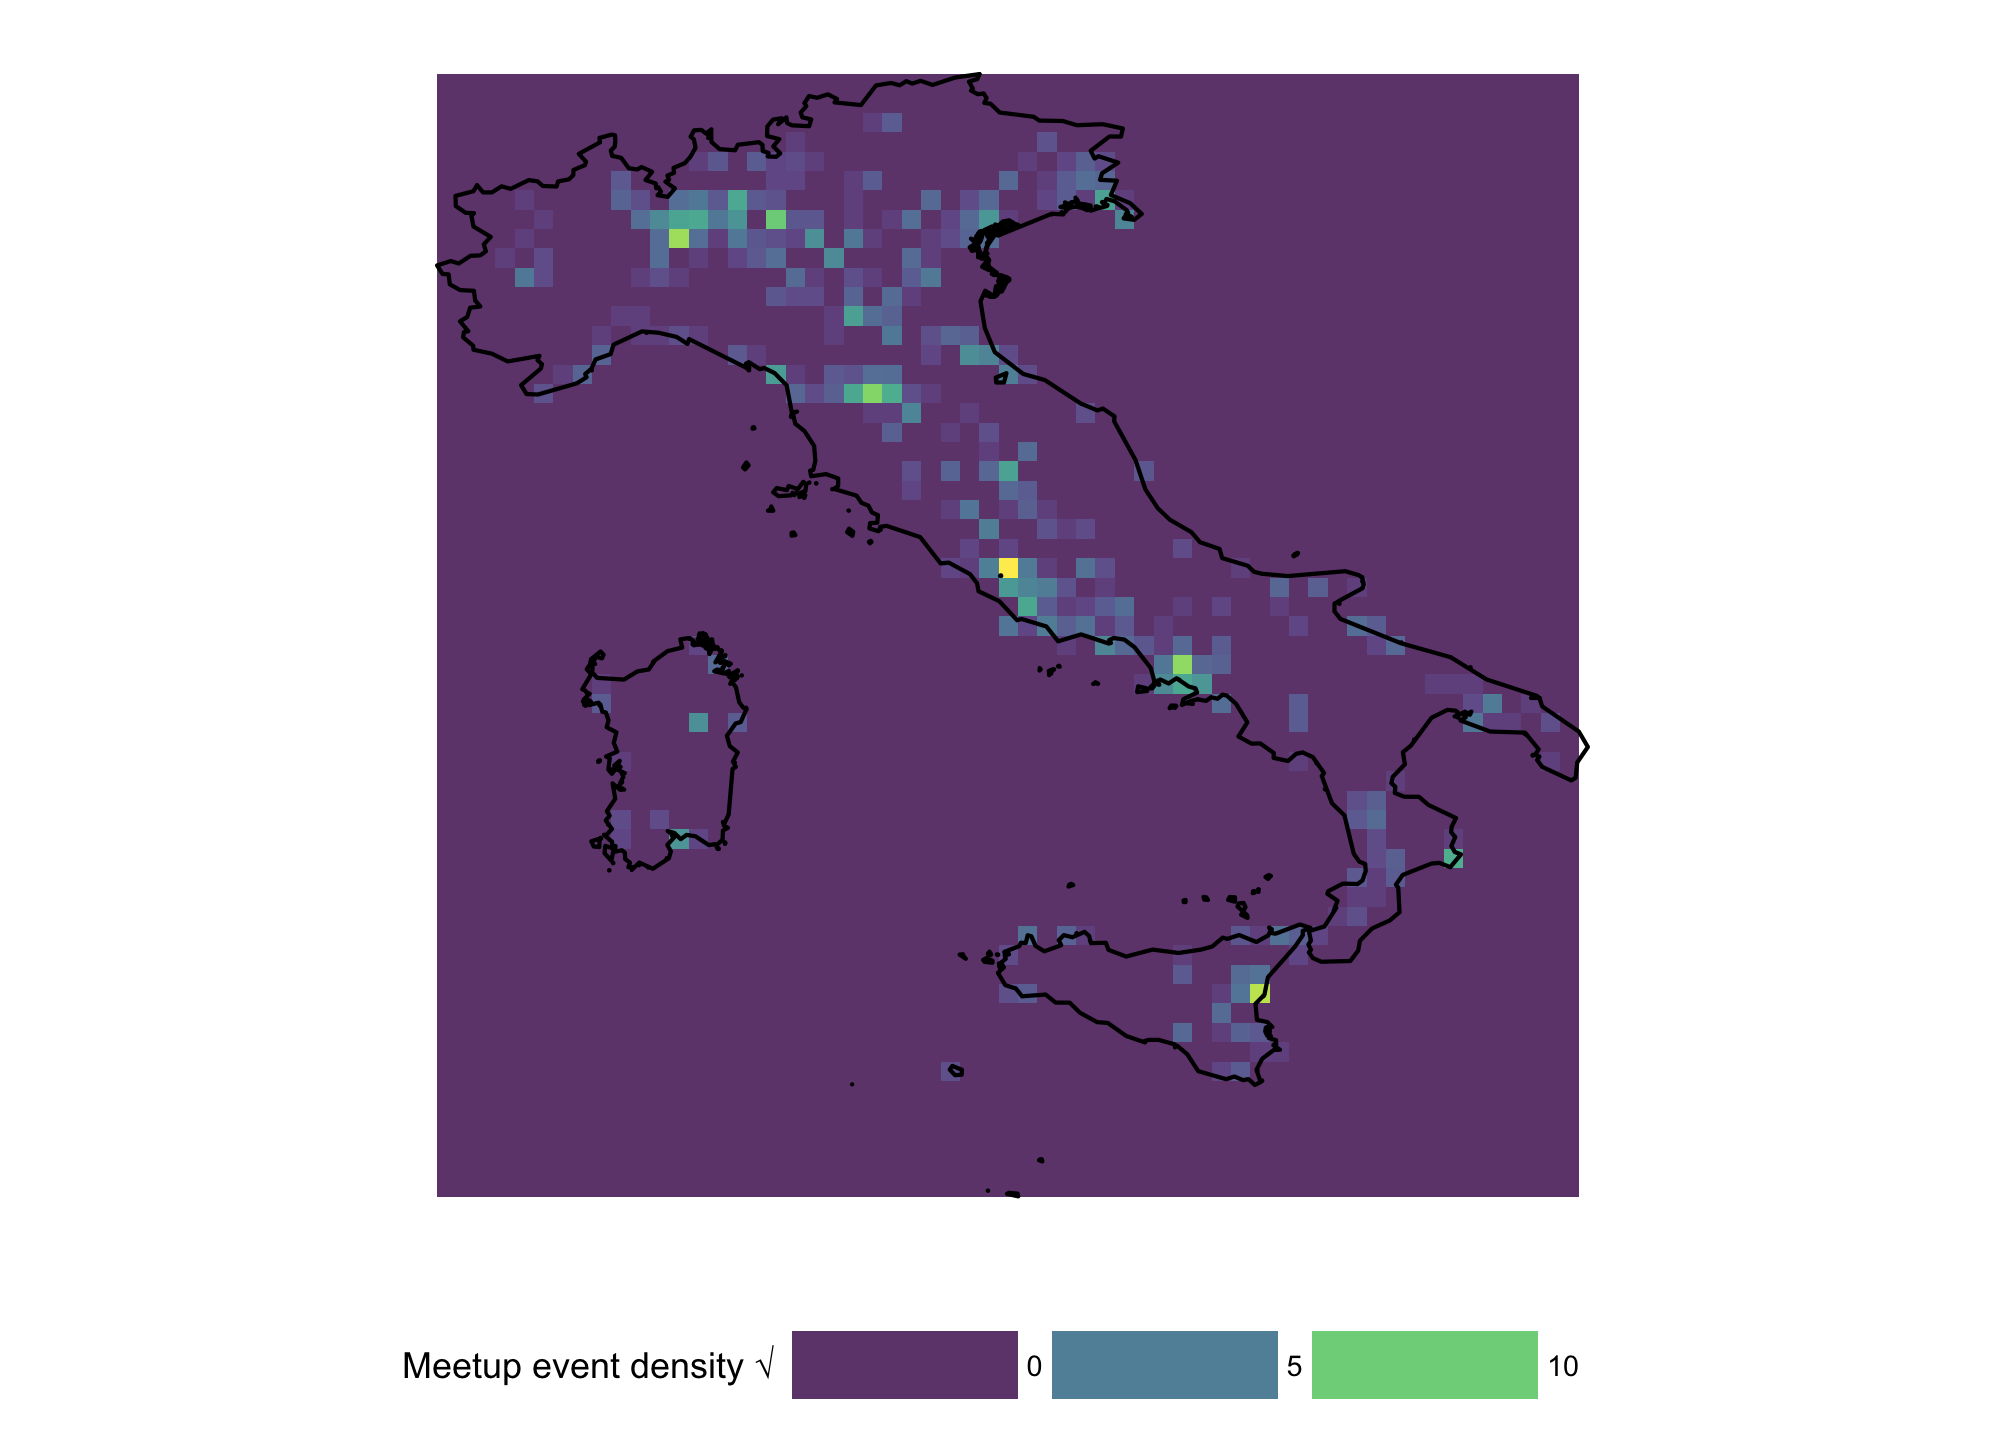
Onsite participation: Meetup events
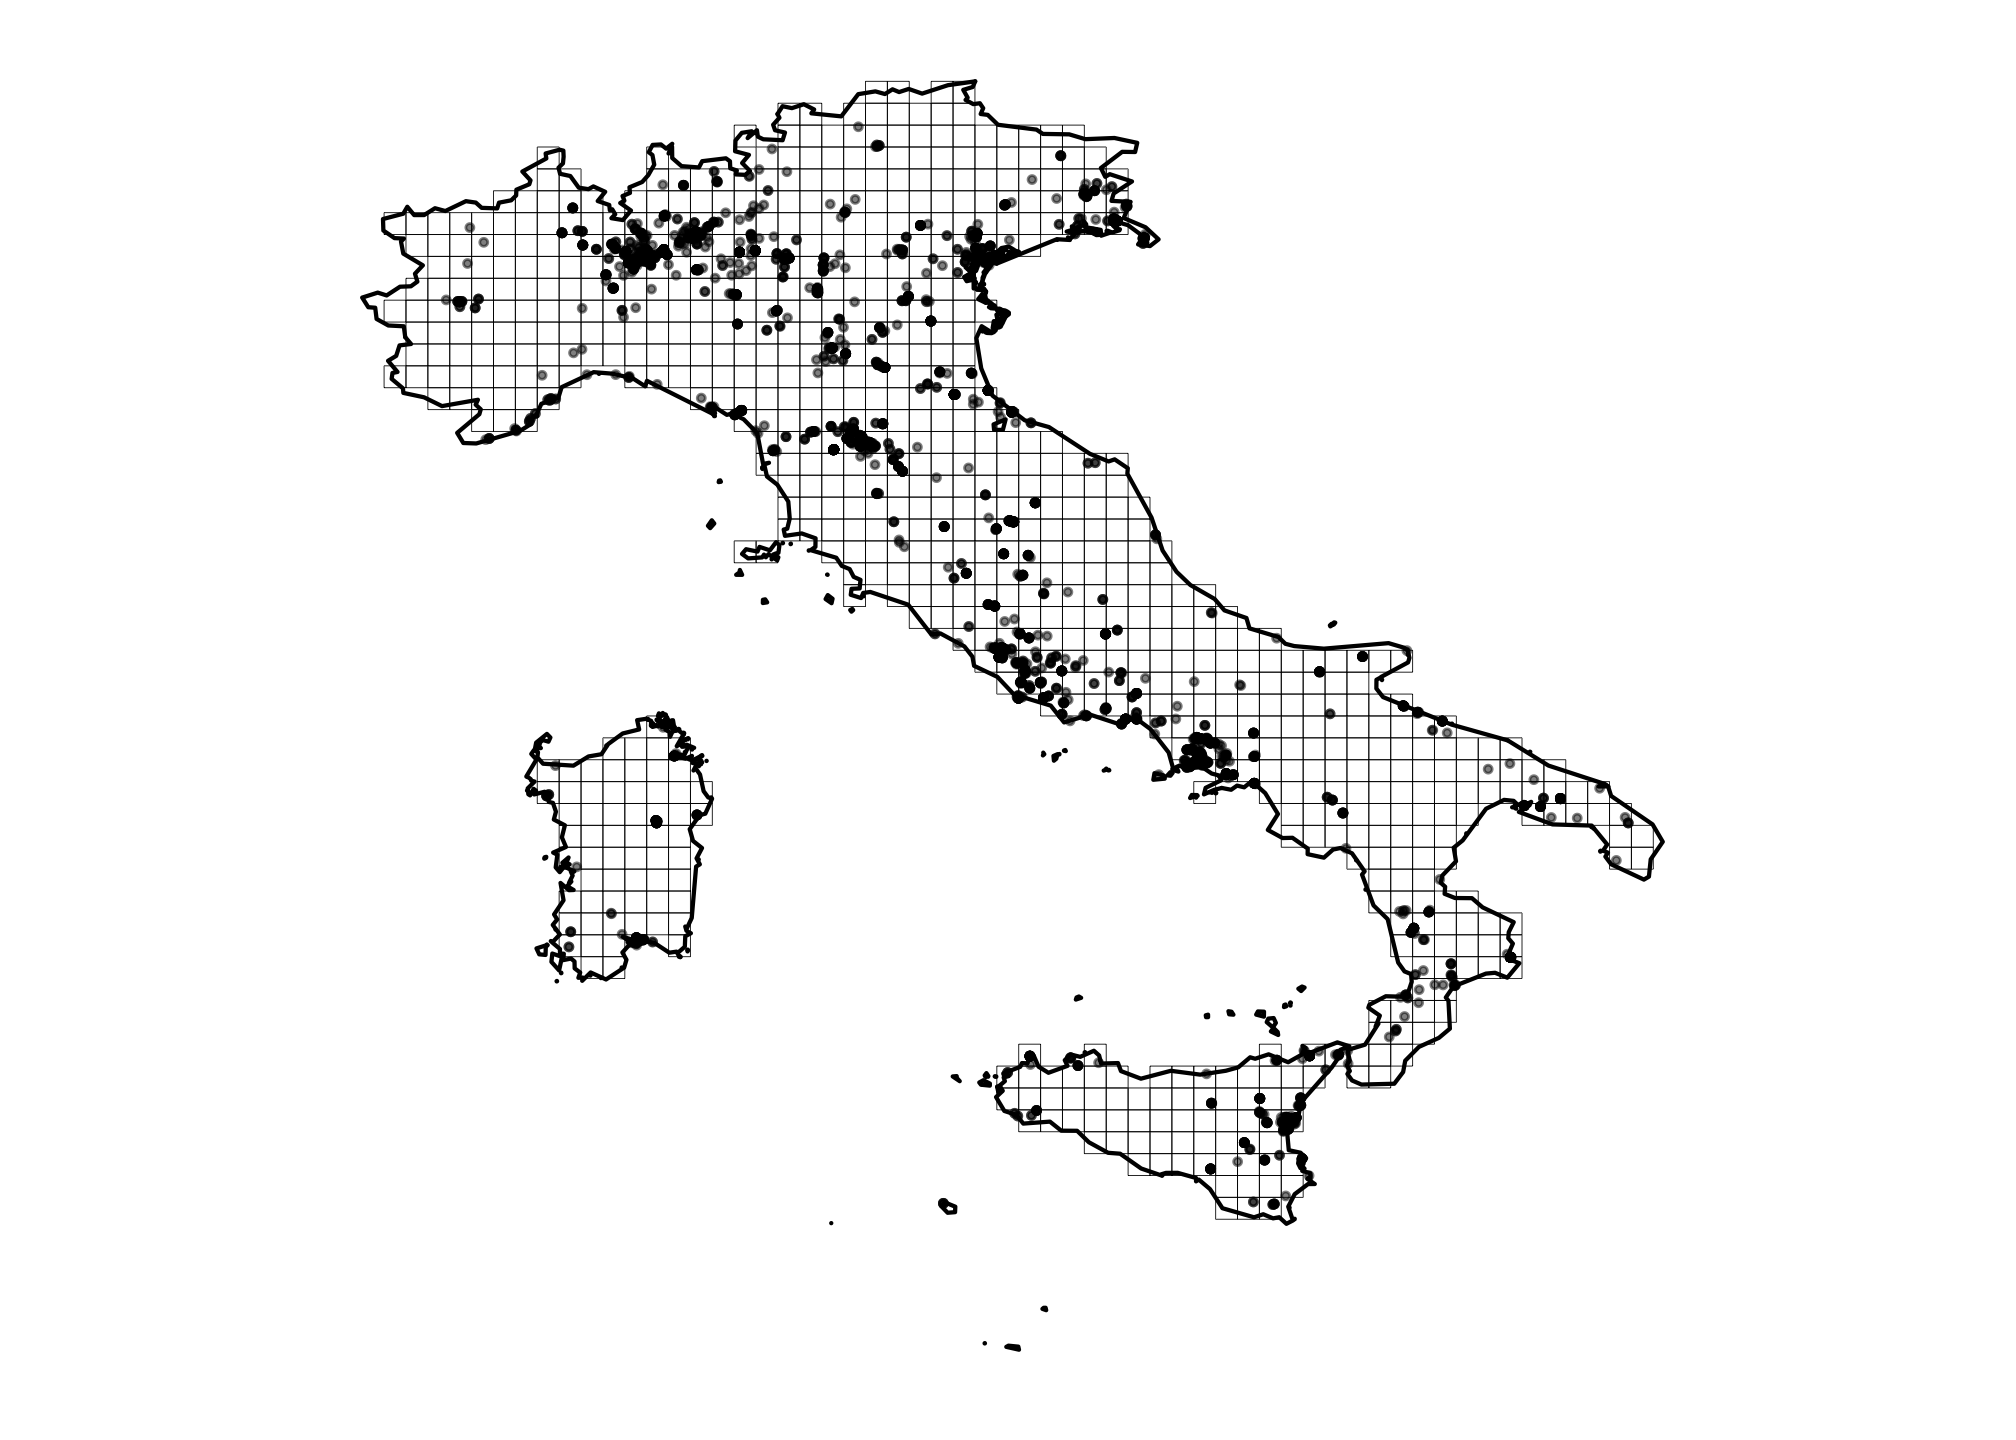
Since 2005, the M5S has employed Meetup.com to allow militants or simple sympathisers to meet in Italy and around the world. By interrogating the API of Meetup.com for all groups linked to Beppe Grillo or the M5S, I am able to map the frequencies of events organised over time by the groups.
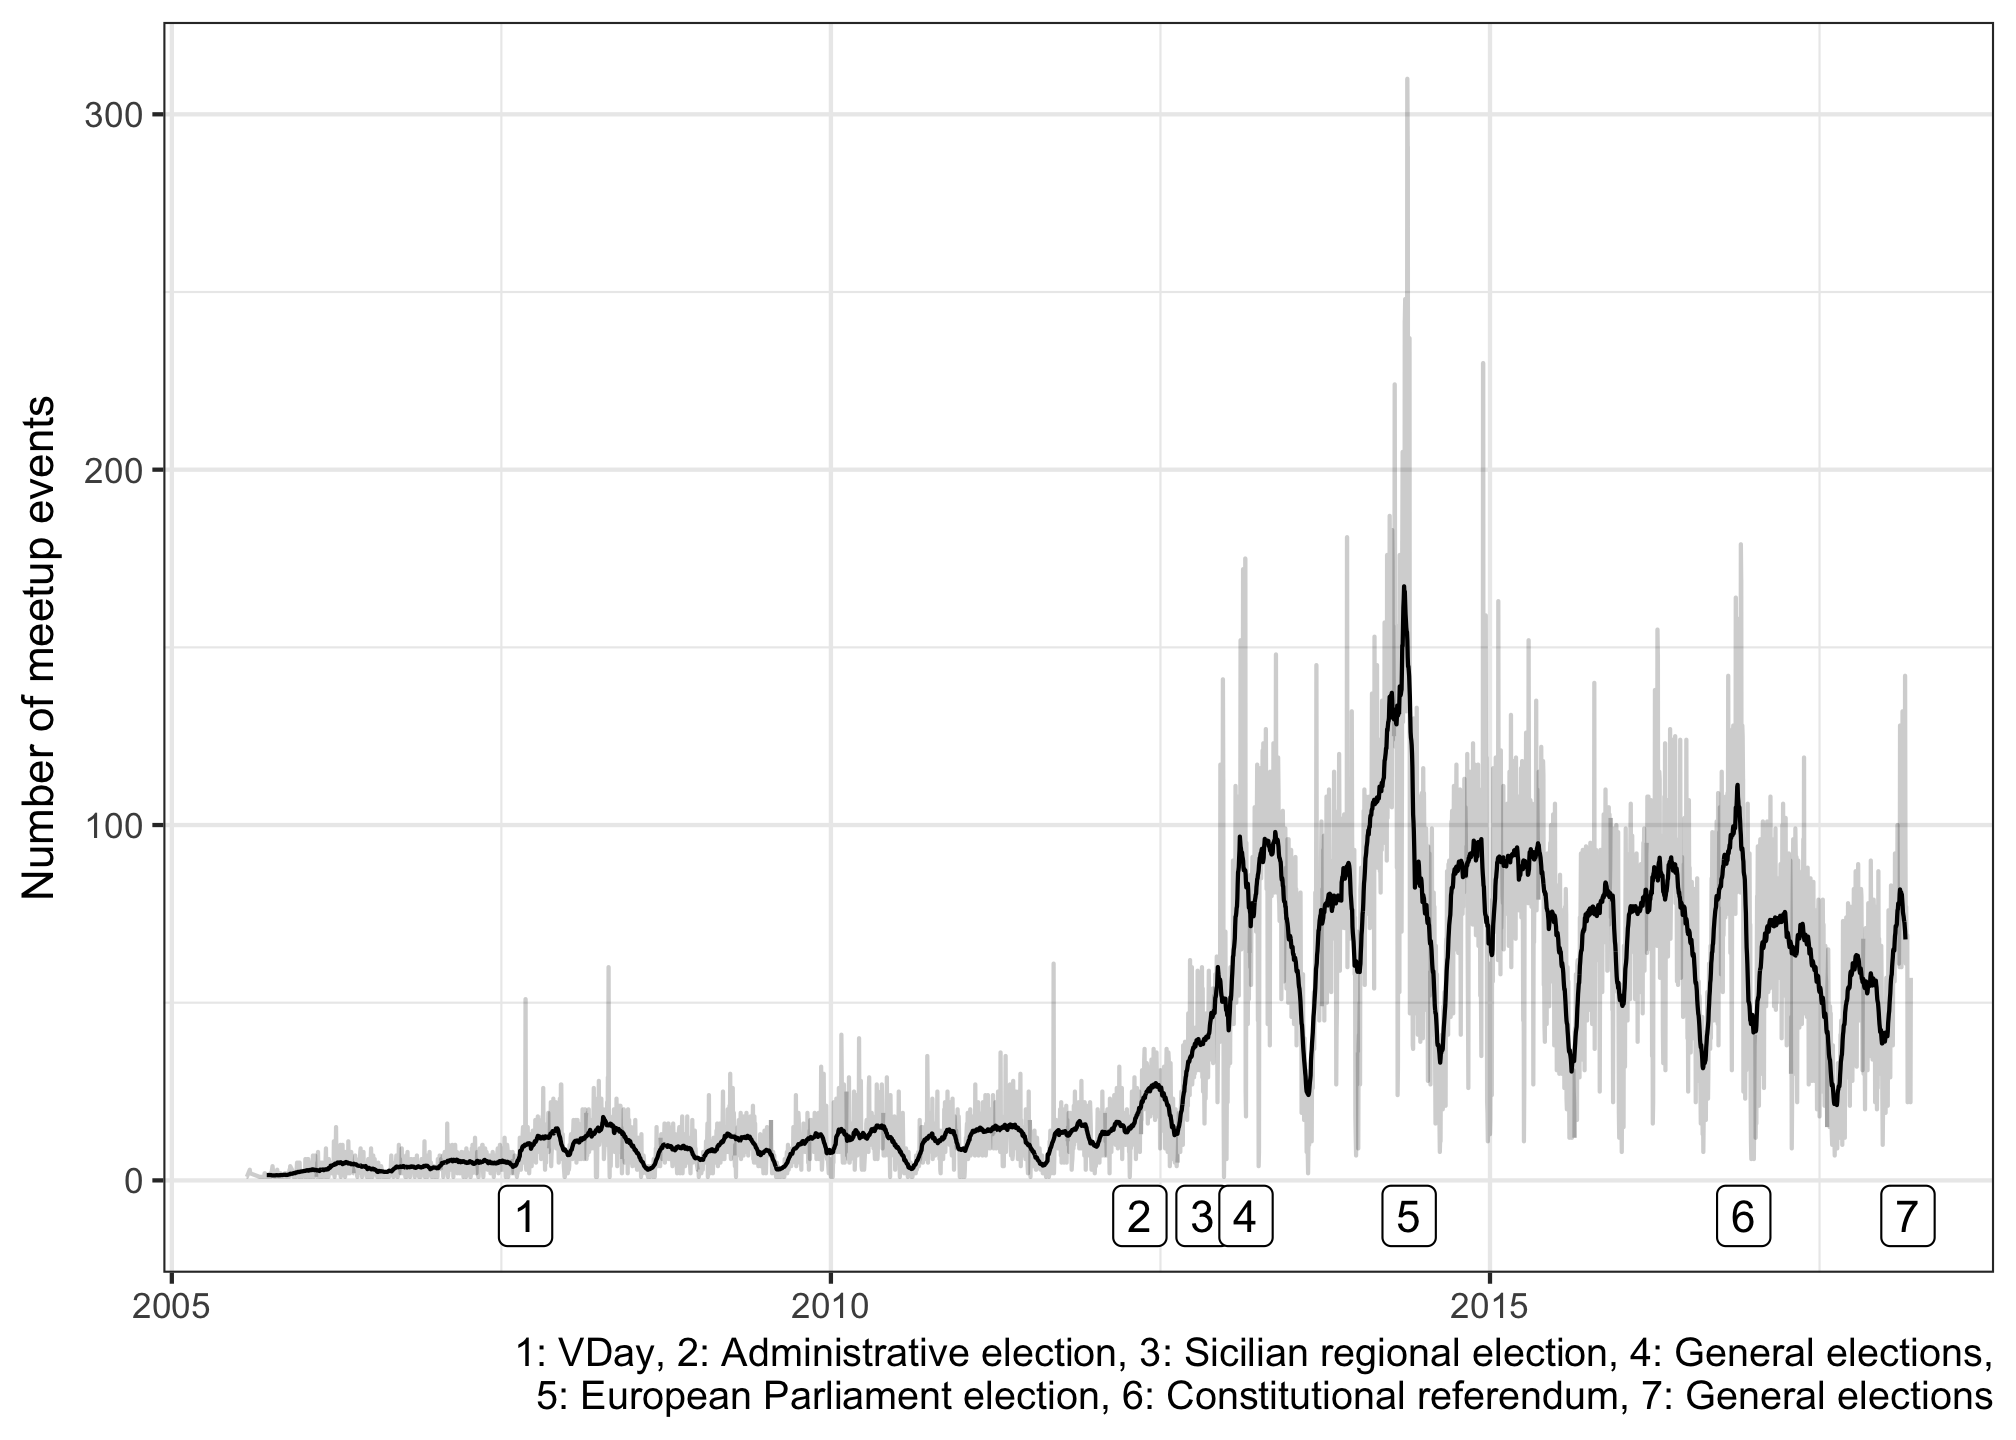
Elections (but also the V-Day of 2007) are clearly associated with a spike in mobilisation. Assuming that the number of events organised throughout the country is geographically correlated with the support for the Movement, I calculate the territorial density of events organised in the 90 days preceding the election and I test its association with local electoral support.
Strength and significance of the territorial density of events are controlled for together with the strength and significance of the variables of the previous models. The coefficients below have been standardised so that the variance of both dependent and independent variables is 1.
| Dependent variable: | ||||||
| M5S (% 2018) | M5S (% difference 2018-2013) | |||||
| Country | Centre-North | South and islands | Country | Centre-North | South and islands | |
| (1) | (2) | (3) | (4) | (5) | (6) | |
| Pop. density (log) | 0.146*** | 0.200*** | 0.098*** | 0.024* | -0.048** | 0.125*** |
| (0.001) | (0.001) | (0.002) | (0.071) | (0.080) | (0.122) | |
| Unemployment % | 0.241*** | 0.355*** | 0.011 | 0.079*** | 0.059*** | -0.104*** |
| (0.032) | (0.041) | (0.052) | (2.396) | (3.577) | (3.219) | |
| Housewives % | 0.001 | -0.128*** | 0.256*** | -0.122*** | -0.076*** | -0.177*** |
| (0.019) | (0.022) | (0.031) | (1.425) | (1.895) | (1.951) | |
| Not workforce below 65 % | 0.366*** | 0.386*** | -0.142** | 0.574*** | 0.454*** | 0.083 |
| (0.022) | (0.025) | (0.042) | (1.676) | (2.193) | (2.618) | |
| Over 65% | -0.319*** | -0.287*** | 0.041 | -0.625*** | -0.487*** | -0.272*** |
| (0.052) | (0.060) | (0.101) | (3.958) | (5.225) | (6.230) | |
| With degree % | 0.210*** | 0.240*** | -0.013 | 0.150*** | 0.089*** | -0.025 |
| (0.038) | (0.040) | (0.086) | (2.861) | (3.492) | (5.304) | |
| Foreign pop. % | -0.125*** | -0.021 | -0.136*** | -0.166*** | -0.045** | -0.129*** |
| (0.029) | (0.028) | (0.091) | (2.226) | (2.415) | (5.644) | |
| Foreign African pop. % | -0.034*** | -0.066*** | 0.042** | 0.010 | 0.016 | -0.013 |
| (0.072) | (0.064) | (0.238) | (5.471) | (5.553) | (14.755) | |
| Income (’000 € per capita) | -0.440*** | -0.280*** | -0.042* | -0.400*** | -0.092*** | -0.143*** |
| (0.0005) | (0.001) | (0.002) | (0.035) | (0.044) | (0.093) | |
| Meetup event density √ | -0.023** | -0.059*** | 0.103*** | 0.066*** | 0.061*** | 0.258*** |
| (0.0005) | (0.0005) | (0.001) | (0.038) | (0.043) | (0.061) | |
| Constant | 0.000*** | 0.000*** | 0.000*** | 0.000*** | 0.000 | 0.000*** |
| (0.015) | (0.016) | (0.027) | (1.097) | (1.359) | (1.690) | |
| Observations | 7,948 | 5,399 | 2,549 | 7,936 | 5,388 | 2,548 |
| R2 | 0.578 | 0.278 | 0.219 | 0.476 | 0.040 | 0.197 |
| Adjusted R2 | 0.578 | 0.276 | 0.216 | 0.475 | 0.039 | 0.194 |
| Note: | p<0.1; p<0.05; p<0.01 | |||||
- Unemployment is associated with support for the M5S only in the Centre-North. In the South unemployment is only significant — but negatively correlated — when we measure its association with the increase in votes.
- A lower Income is consistently a predictor of support for the Movement.
- Foreign population, but not foreign African population is overall less present in areas where the Movement is strong.
- Generally, the M5S is stronger in areas that are inhabited more densely and by younger people.
- Finally, the capillarity of the local organisation is strongly associated with support in the South (in fact, the strongest positive predictor) but not in the Centre-North if you look at the absolute support.
In conclusion, the economic environment is a good predictor of the performance of the Movement but I argue what drives votes in the South is different from what drives votes in the rest of the country.
- In the Centre-North, we can picture the average voter as younger more educated but more likely to be unemployed. It is also more likely to live in economically less dynamic areas (urban but poorer with less immigration and less participation in the workforce).
- In the South (islands included), the picture is different. The average M5S voter lives in areas that are younger (although education does not play a role), urban, poorer but crucially with lower unemployment and (if we look at the absolute number of votes) with higher participation to the workforce. This can be probably explained by the high levels of underemployment and poorly paid unemployment that characterises the South. Political participation has been largely underestimated has a driver of the Southern vote: it is a very strong predictor of both absolute support and for the increase in support.
It’s not (only) the economy, stupid
Participation matters in creating new consent. The economic narrative of the M5S has, of course, played an important part in motivating voters. But the explanatory trajectory for the Southern vote
unemployment → political offer of guaranteed minimum income → electoral support
is simply not supported by the data. Political decisions such a voting are always complex and naturally open to multiple reading. Considerations about personal and community’s economic wealth are important. But so is political ideology. The ideology of the M5S is thin and because of this mostly overlooked. The Movement’s political platform is non-traditional in the sense that is not really about economic justice, national sovereignty, or environmental preservation. Indeed on these issues, a whole range of opinions are present in the Movement. The M5S is not progressive or conservative. The ideology of the Movement is defined by the reconfiguration of mass participation: from representative, mediated by party and parliament, to direct and unmediated. The results of the analysis of the density of onsite events organised by groups linked to the Movement indeed supports the importance of the experience of individual participation in a macro region (the South) plagued by political dysfunctionalities. Participation must not be directly experienced (the large majority of M5S voters clearly never attended a meeting) but the mere presence of a locally grounded network of participating and self-organised individuals is probably enough to give credibility to the ideological message of political disruption by a direct reappropriation of political power.
A replication package for the analysis presented in the article is available here.